Presence and absence
This example includes mock communities which are a controlled setup where we know what the classifier ought ideally to report for every sample - and all their expected marker sequences are in the classification database.
There are five different mock communities, made up with different numbers of individuals. Running an overall assessment on the pooled species assignments from all three markers we have both false positives, and false negatives:
$ cut -f 1-5,9,11 summary/pooled.assess.onebp.tsv
<SEE TABLE BELOW>
As a table:
#Species |
TP |
FP |
FN |
TN |
F1 |
Ad-hoc-loss |
|---|---|---|---|---|---|---|
OVERALL |
85 |
21 |
3 |
1104331 |
0.88 |
0.220 |
Acizzia alternata |
16 |
1 |
0 |
3 |
0.97 |
0.059 |
Acizzia solanicola |
16 |
1 |
0 |
3 |
0.97 |
0.059 |
Bactericera cockerelli |
10 |
0 |
2 |
8 |
0.91 |
0.167 |
Diuraphis noxia |
11 |
3 |
1 |
5 |
0.85 |
0.267 |
Metopolophium dirhodum |
16 |
0 |
0 |
4 |
1.00 |
0.000 |
Rhopalosiphum nymphaeae |
0 |
16 |
0 |
4 |
0.00 |
1.000 |
Rhopalosiphum padi |
16 |
0 |
0 |
4 |
1.00 |
0.000 |
OTHER 55215 SPECIES IN DB |
0 |
0 |
0 |
1104300 |
0.00 |
0.000 |
Our 3 false negatives on the pooled results are Bactericera cockerelli (2
cases, 1000-Pool-1` and ``250-Pool-4 matching the authors, with
500-Pool-4 just passing at 62 reads), and Diuraphis noxia (1 case,
500-Pool-3). The authors also reported 500-Pool-3 missing D. noxia,
here it just passes the threshold at 54 reads.
Most of the false positives are 16 cases of Rhopalosiphum nymphaeae, which
is unfortunately indistinguishable from community member R. padi with the
12S marker (see the thapbi_pict conflicts ... output).
Likewise splitting Acizzia alternata and solanicola is not possible with
18S, but we still have unwanted Acizzia alternata and solanicola from 12S
in 500 Pool 2, with 53 and 96 reads respectively. These counts are low
enough to consider raising the abundance threshold(s) to exclude them. In both
cases they match the dominant 12S sequences from the other controls and could
be due to Illumina tag switching?
The remaining false positives are 3 cases of Diuraphis noxia via the 18S marker, and in one case via the COI marker.
The authors only reported false positives for Diuraphis noxia in one sample,
1000-Pool-1 for both COI and 18S (Figure 3), traced to an unwanted nymph
specimen (Figure 4). We see that too, but have two other false positives:
$ cut -f 3,37,38 summary/pooled.samples.onebp.tsv
<SEE TABLE BELOW>
Note 576 unwanted reads in 1000-Pool-1 for Diuraphis noxia (consistent
with the author’s analysis), but also 503 reads in 100-Pool-5 and 63 in
1000-Pool-5 with a fuzzy match for Diuraphis noxia and/or
Metopolophium dirhodum:
sample_alias |
Diuraphis noxia |
Diuraphis noxia;Metopolophium dirhodum |
|---|---|---|
100-Pool-1 |
0 |
0 |
250-Pool-1 |
0 |
0 |
500-Pool-1 |
0 |
0 |
1000-Pool-1 |
576 |
0 |
100-Pool-2 |
1630 |
0 |
250-Pool-2 |
1454 |
0 |
500-Pool-2 |
1660 |
0 |
1000-Pool-2 |
228 |
0 |
100-Pool-3 |
2705 |
126 |
250-Pool-3 |
4059 |
0 |
500-Pool-3 |
0 |
0 |
1000-Pool-3 |
94 |
0 |
100-Pool-4 |
6446 |
113 |
250-Pool-4 |
5701 |
0 |
500-Pool-4 |
742 |
0 |
1000-Pool-4 |
684 |
54 |
100-Pool-5 |
0 |
503 |
250-Pool-5 |
0 |
0 |
500-Pool-5 |
0 |
0 |
1000-Pool-5 |
0 |
63 |
Trap-1 |
25009 |
135 |
Trap-10 |
126570 |
53 |
Trap-2 |
106 |
0 |
Trap-3 |
272 |
0 |
Trap-4 |
1351 |
0 |
Trap-5 |
4235 |
0 |
Trap-6 |
16758 |
0 |
Trap-7 |
2733 |
0 |
Trap-8 |
99678 |
53 |
Trap-9 |
37358 |
0 |
Consulting the read report, these Diuraphis noxia false positives from
100-Pool-5 (503 copies) and 1000-Pool-5 (just 63 copies) are from the
same 18S sequence:
>d153aa679f3c184a2790cd26aac9c784
CCGCATTAAGGTGAAACCGCGAAAGGCTCATTAAATCAGTTGTGGTTCCTTAGATCGTACCCAAGTTACTTGGATAACTG
TGGTAATTCTAGAGCTAATACATGCCGACAGAGTTCCGACCGTCGCGGCGCCCTCGGGCGTCGCGCGCGGGAGGAACGCT
TTTATTAGATCAAAACCGGCCCGTCGCGGCGCGCTTCGTGCGCGTCCCGATCGCGGCCCGCGCAAAGACCTGGTGACTCT
GAATAACTTCGAGCTGATCGCACGGTCTCCGTACCGGCGACGCATCTTTCAAAT
With over 500 copies in 100-Pool-5 this cannot be dismissed as a
difference in noise filtering versus the authors’ original analysis.
Querying this on NCBI BLAST confirms it to be 1bp away from multiple
Diuraphis noxia accessions, and a Metopolophium dirhodum voucher sequence
(as in the DB here), but also third species via a sequence labelled as
Acyrthosiphon pisum. Rather than reporting multiple conflicting species,
the author’s pipeline likely assigned a lower rank?
Visualisation
We can look at this visually by reproducing Figure 3 from the original paper.
The authors provided their R based analysis, from which I have exported the
numbers used to draw the figure (see figure3original.R) giving a simple
tab-separated file (figure3original.tsv). Likewise the Python script
figure3reproduction.py will produce an equivalent table using the output
from THABPI PICT (figure3reproduction.tsv). Finally, Python script
recreate_figure3.py uses MatPlotLib to reproduce an annotated recreation
of the original.
Original analysis:

This re-analysis:
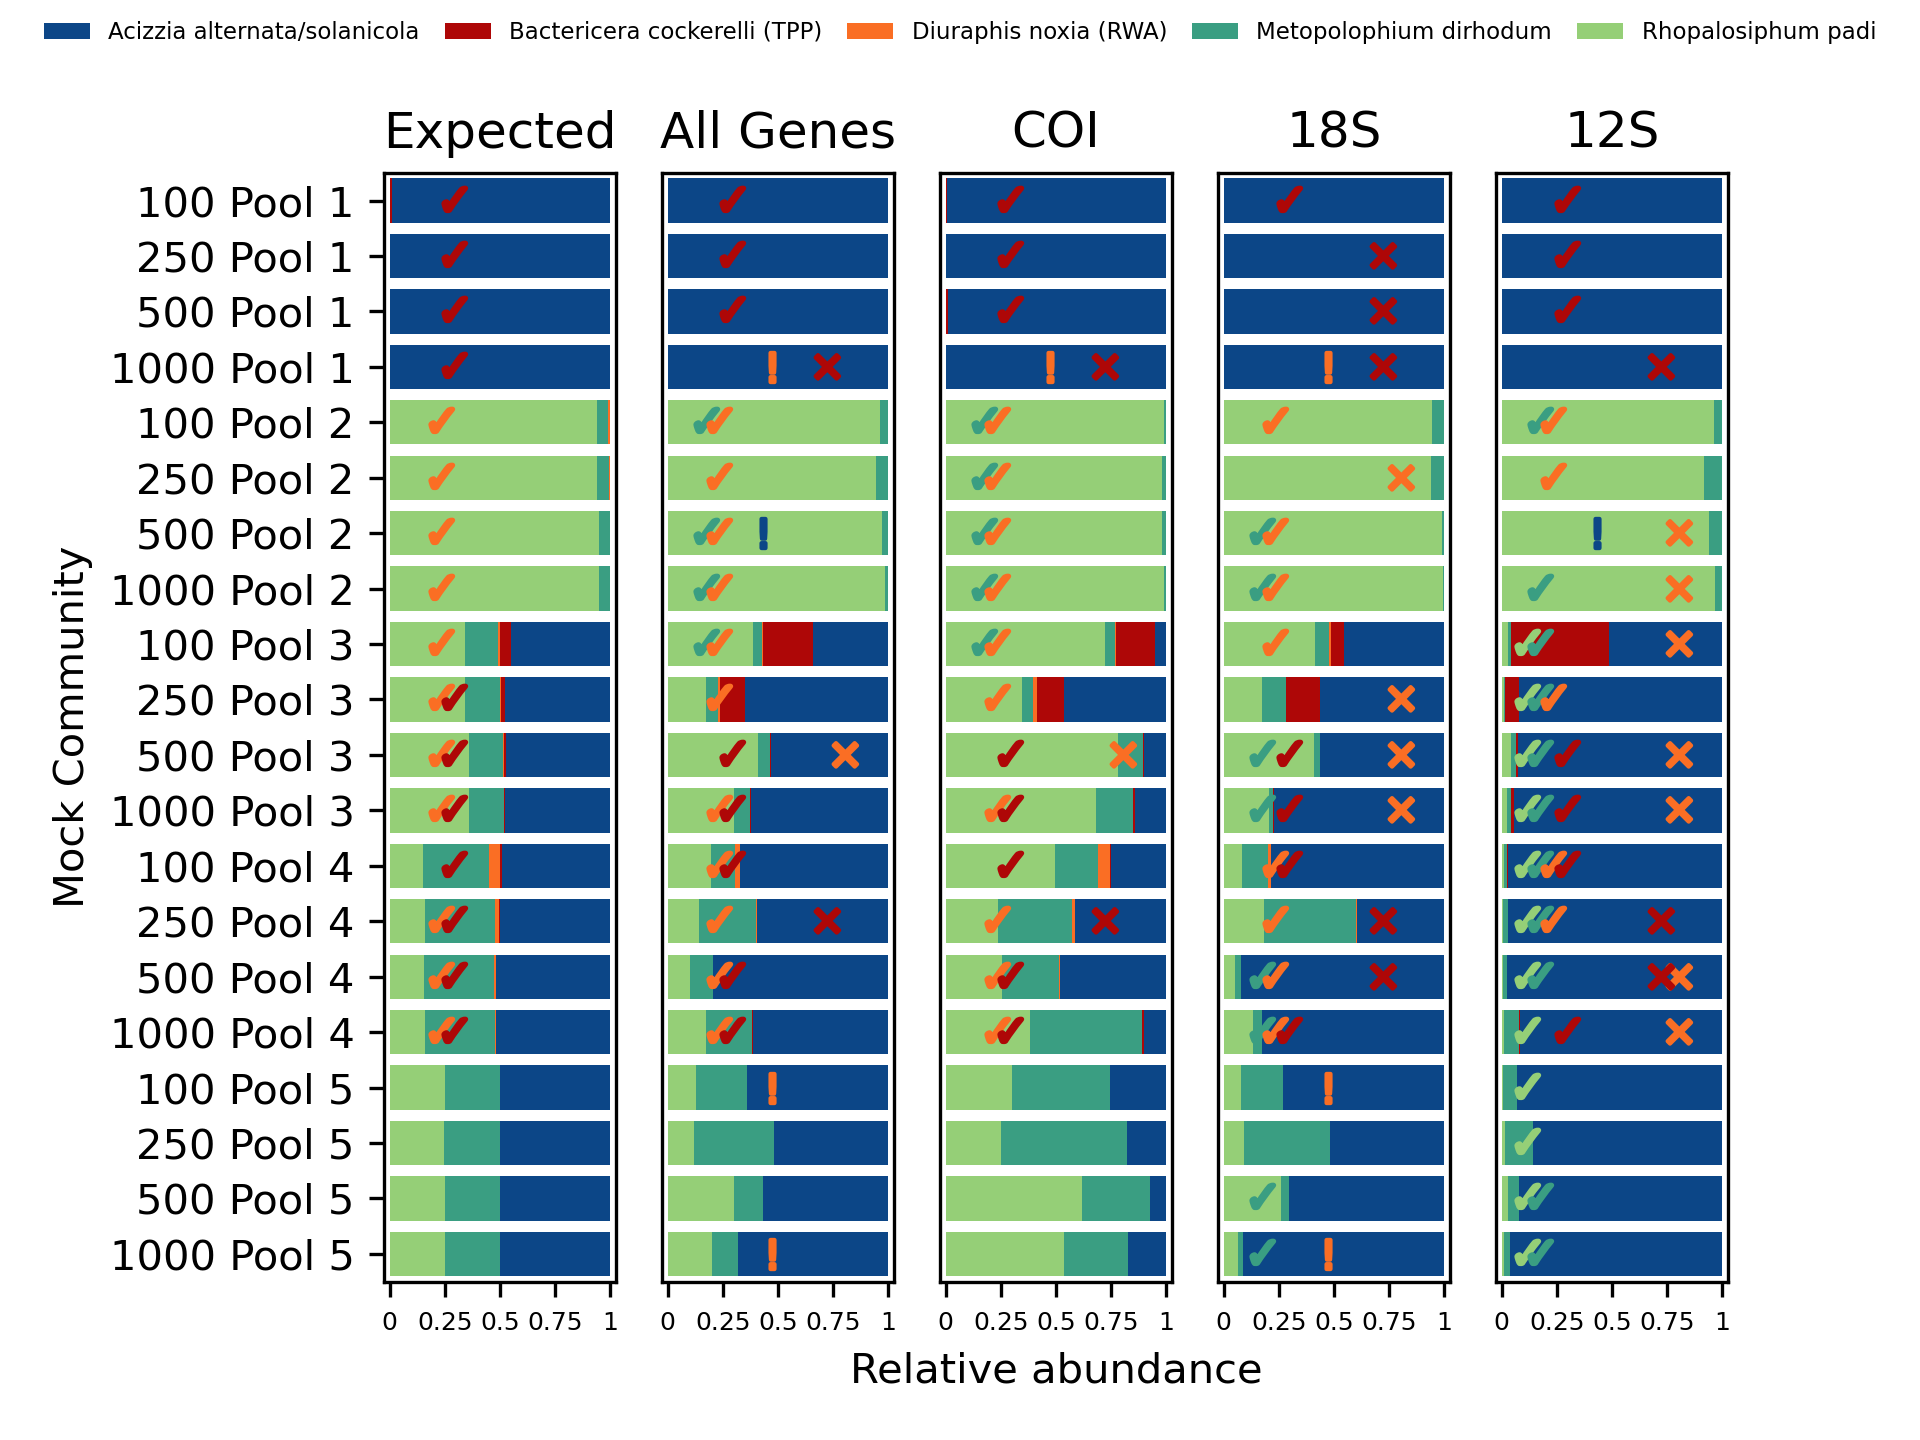
In the original paper the false positives and false negatives were marked with pluses and minus in colour coded circles, and these were added by hand. Here this annotation is automated, but is less aesthetically pleasing. The false negatives get a cross, false positives are shown with an exclamation mark, and furthermore low abundance (under 5%) true positives get a tick. Again, these are all species coloured.
Overall this seems to show very good agreement with the published analysis.